Conservation Intelligence: When More Sensors Don't Mean More Awareness
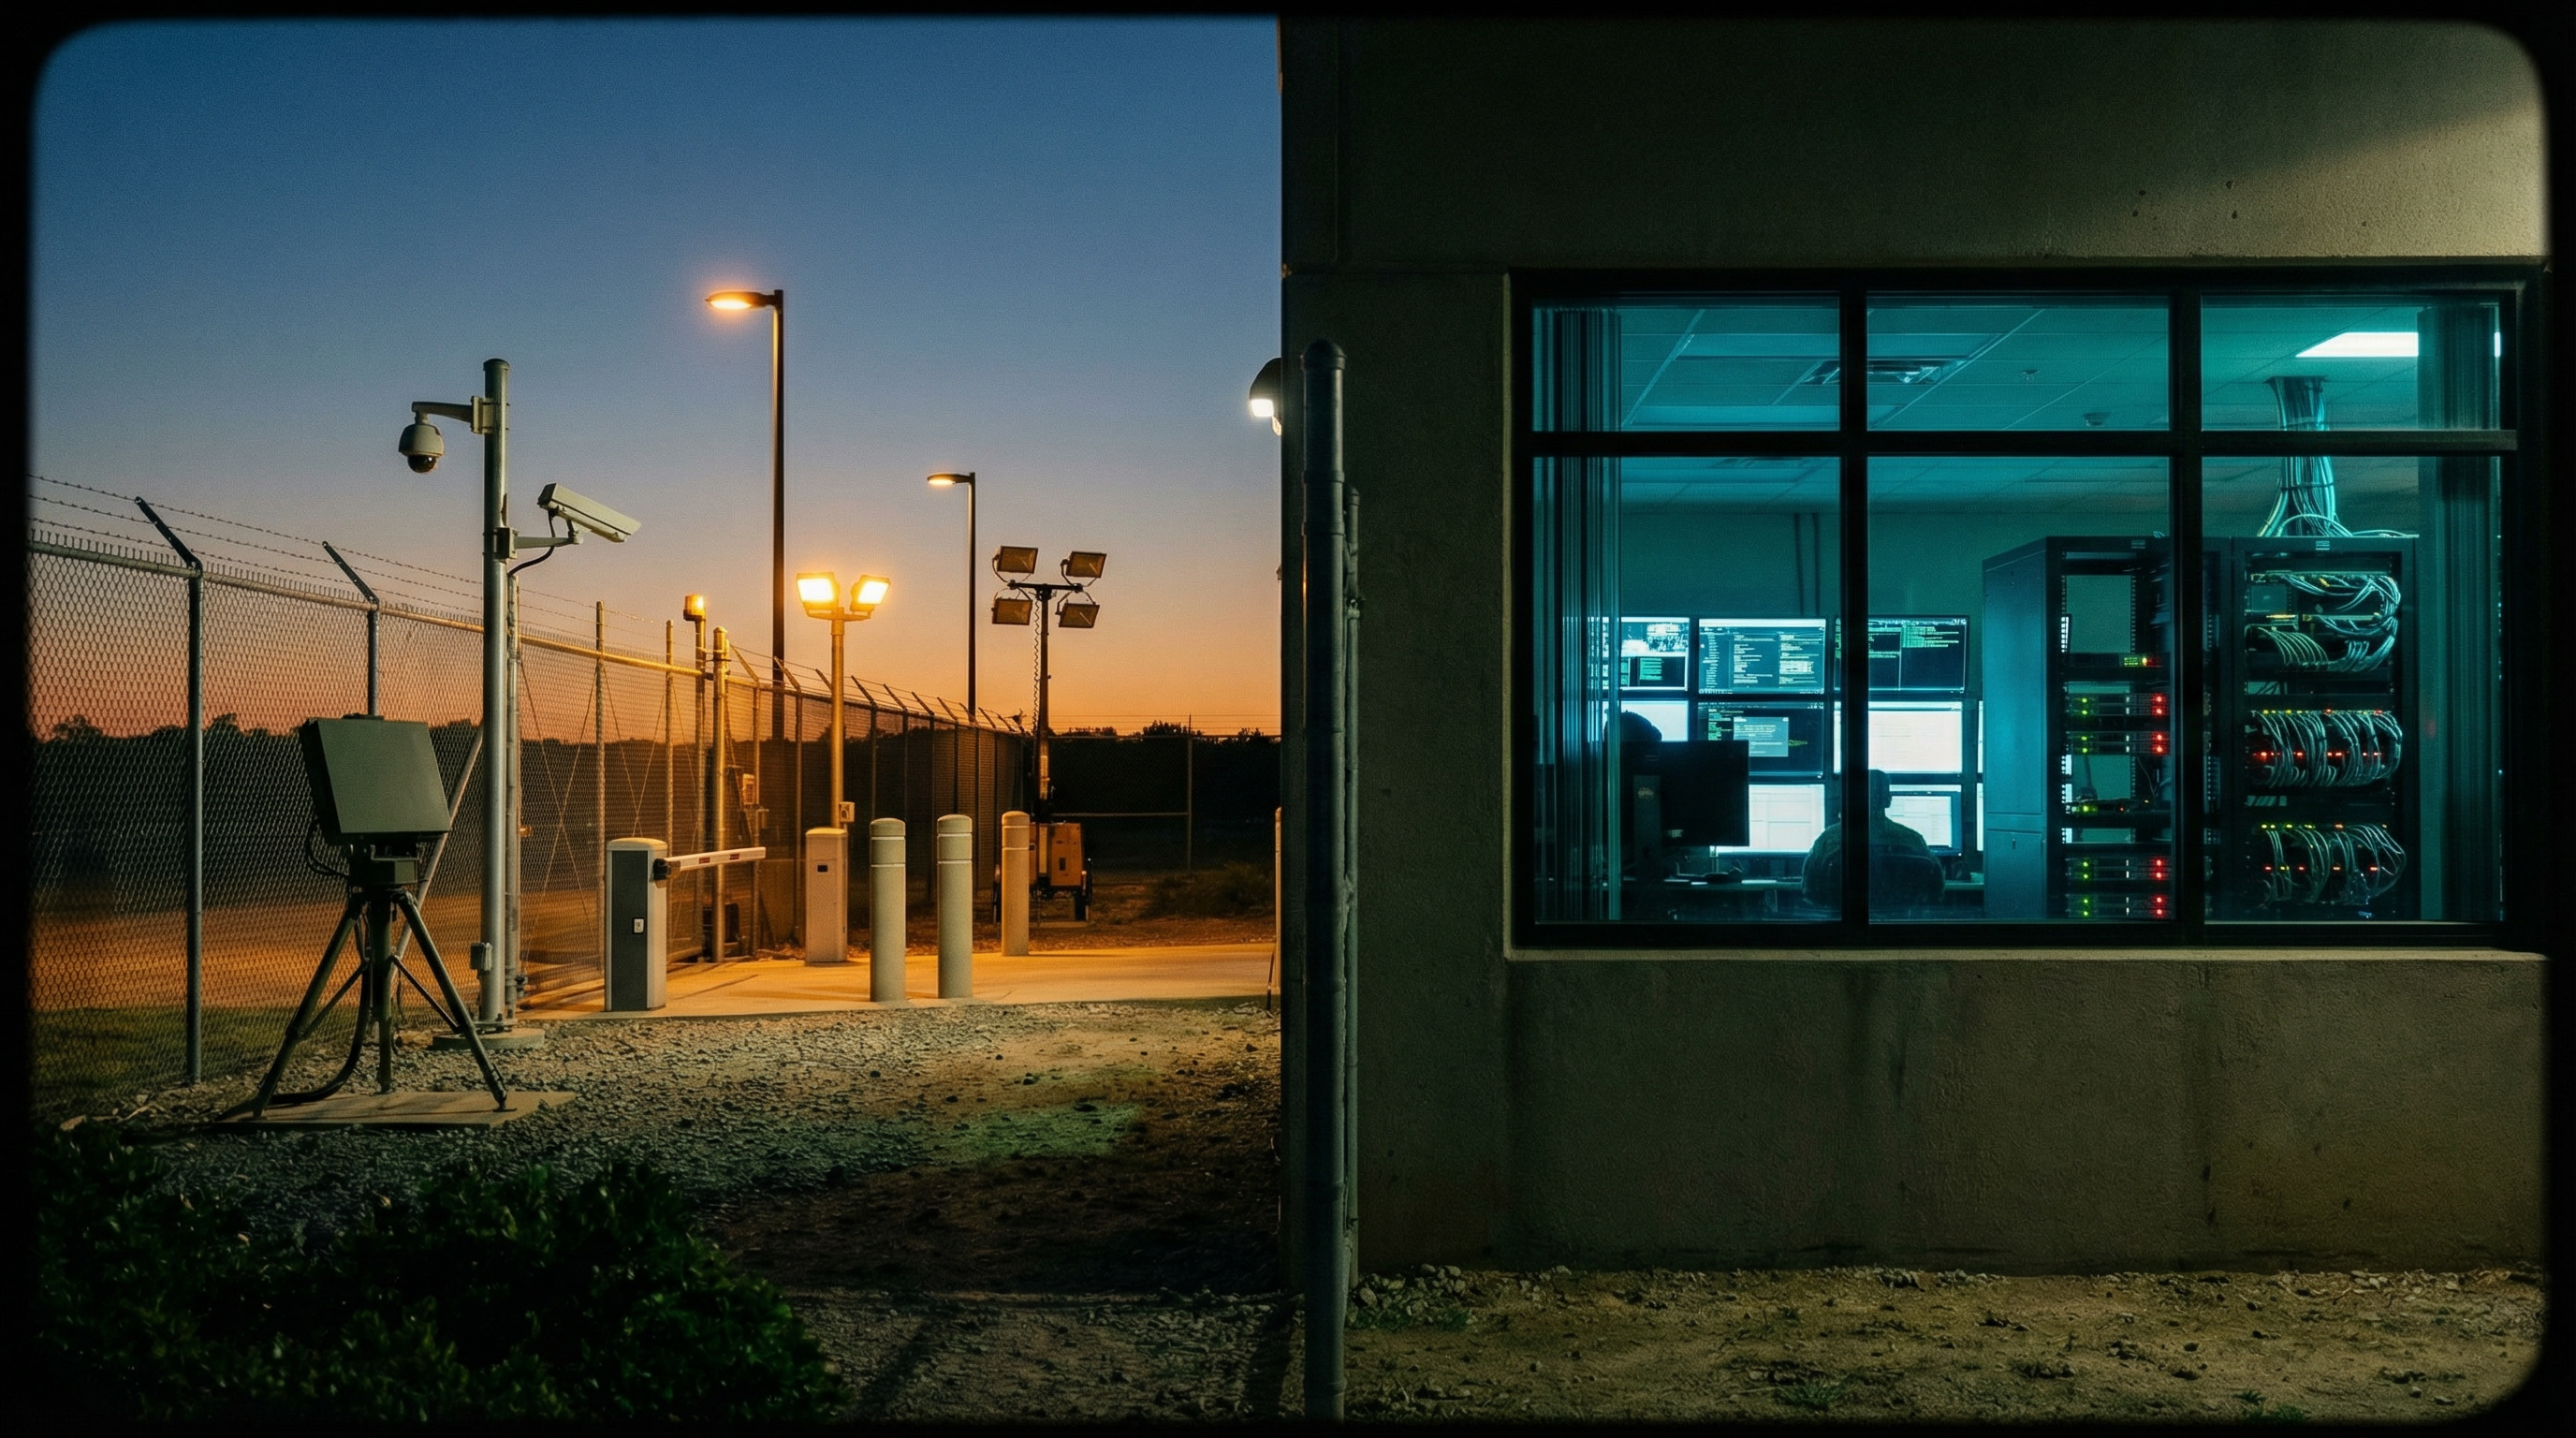
Protected area agencies have invested in vessel tracking, satellite imagery, field patrols, and sensor networks, each generating data in isolation. The result is more monitoring but not more awareness. The structural gap isn't in any single tool. It's in the space between them.

The Paradox of More Data, Less Clarity
A marine reserve authority tracks fishing vessels through AIS transponders. A separate system monitors vessel registrations and permits. A third platform detects dark vessels, those that have turned off their transponders entirely. A fourth holds species data, visitor permits, and patrol logs.
Each system works. Each one generates data. Each one was purchased or deployed to solve a real problem. And each one operates in complete isolation from the others.
The patrol coordinator checks one system for vessel positions. Switches to another to verify whether that vessel is registered. Opens a third to see if the same vessel triggered a dark vessel alert last week. Pulls up a fourth to check whether the area it’s operating in has active fishing permits. Four logins. Four interfaces. Four separate versions of the truth about the same vessel on the same day.
By the time the coordinator has assembled this picture manually, the vessel has moved. The window for enforcement has closed. The data existed to prevent the violation. The systems that held it simply never spoke to each other.
This is the conservation intelligence paradox. Agencies have invested heavily in monitoring technology over the past decade, and for good reason. Satellite imagery, AIS/VMS tracking, RF geolocation, camera traps, acoustic sensors, environmental DNA sampling, drone surveys. The sensor layer is richer than it has ever been. But the intelligence layer (the capacity to correlate, reason across sources, and surface actionable insight in time to act) has not kept pace.
More sensors have not produced more awareness. They have produced more data silos.
The Fragmentation Is Structural, Not Accidental
Conservation monitoring systems didn’t fragment because anyone planned it that way. They fragmented because each capability was funded, procured, and deployed independently, often by different donors, different partners, and different technical teams.
A maritime surveillance system arrives as part of an international cooperation agreement. It comes with its own database, its own interface, its own training program. A satellite monitoring capability is funded by an environmental NGO. It has its own processing pipeline, its own alert format, its own delivery mechanism. A vessel registration system was built by a government IT team a decade ago. It runs on infrastructure that predates everything else.
Each system reflects the priorities and technical constraints of the moment it was created. None was designed with the assumption that it would need to share data with systems that didn’t yet exist.
The result is a monitoring architecture that mirrors the organizational chart rather than the operational reality. Maritime surveillance sits in one directorate. Terrestrial monitoring sits in another. Scientific data collection sits in a third. Tourism management sits in a fourth. Each directorate has its own tools, its own data, and its own operational tempo.
When a threat crosses boundaries (a vessel that’s both a tourism operator and a fishing permit holder operating in a scientifically sensitive zone), no single system sees the complete picture. The threat falls into the gap between directorates, between databases, between monitoring paradigms.
What Manual Correlation Actually Costs
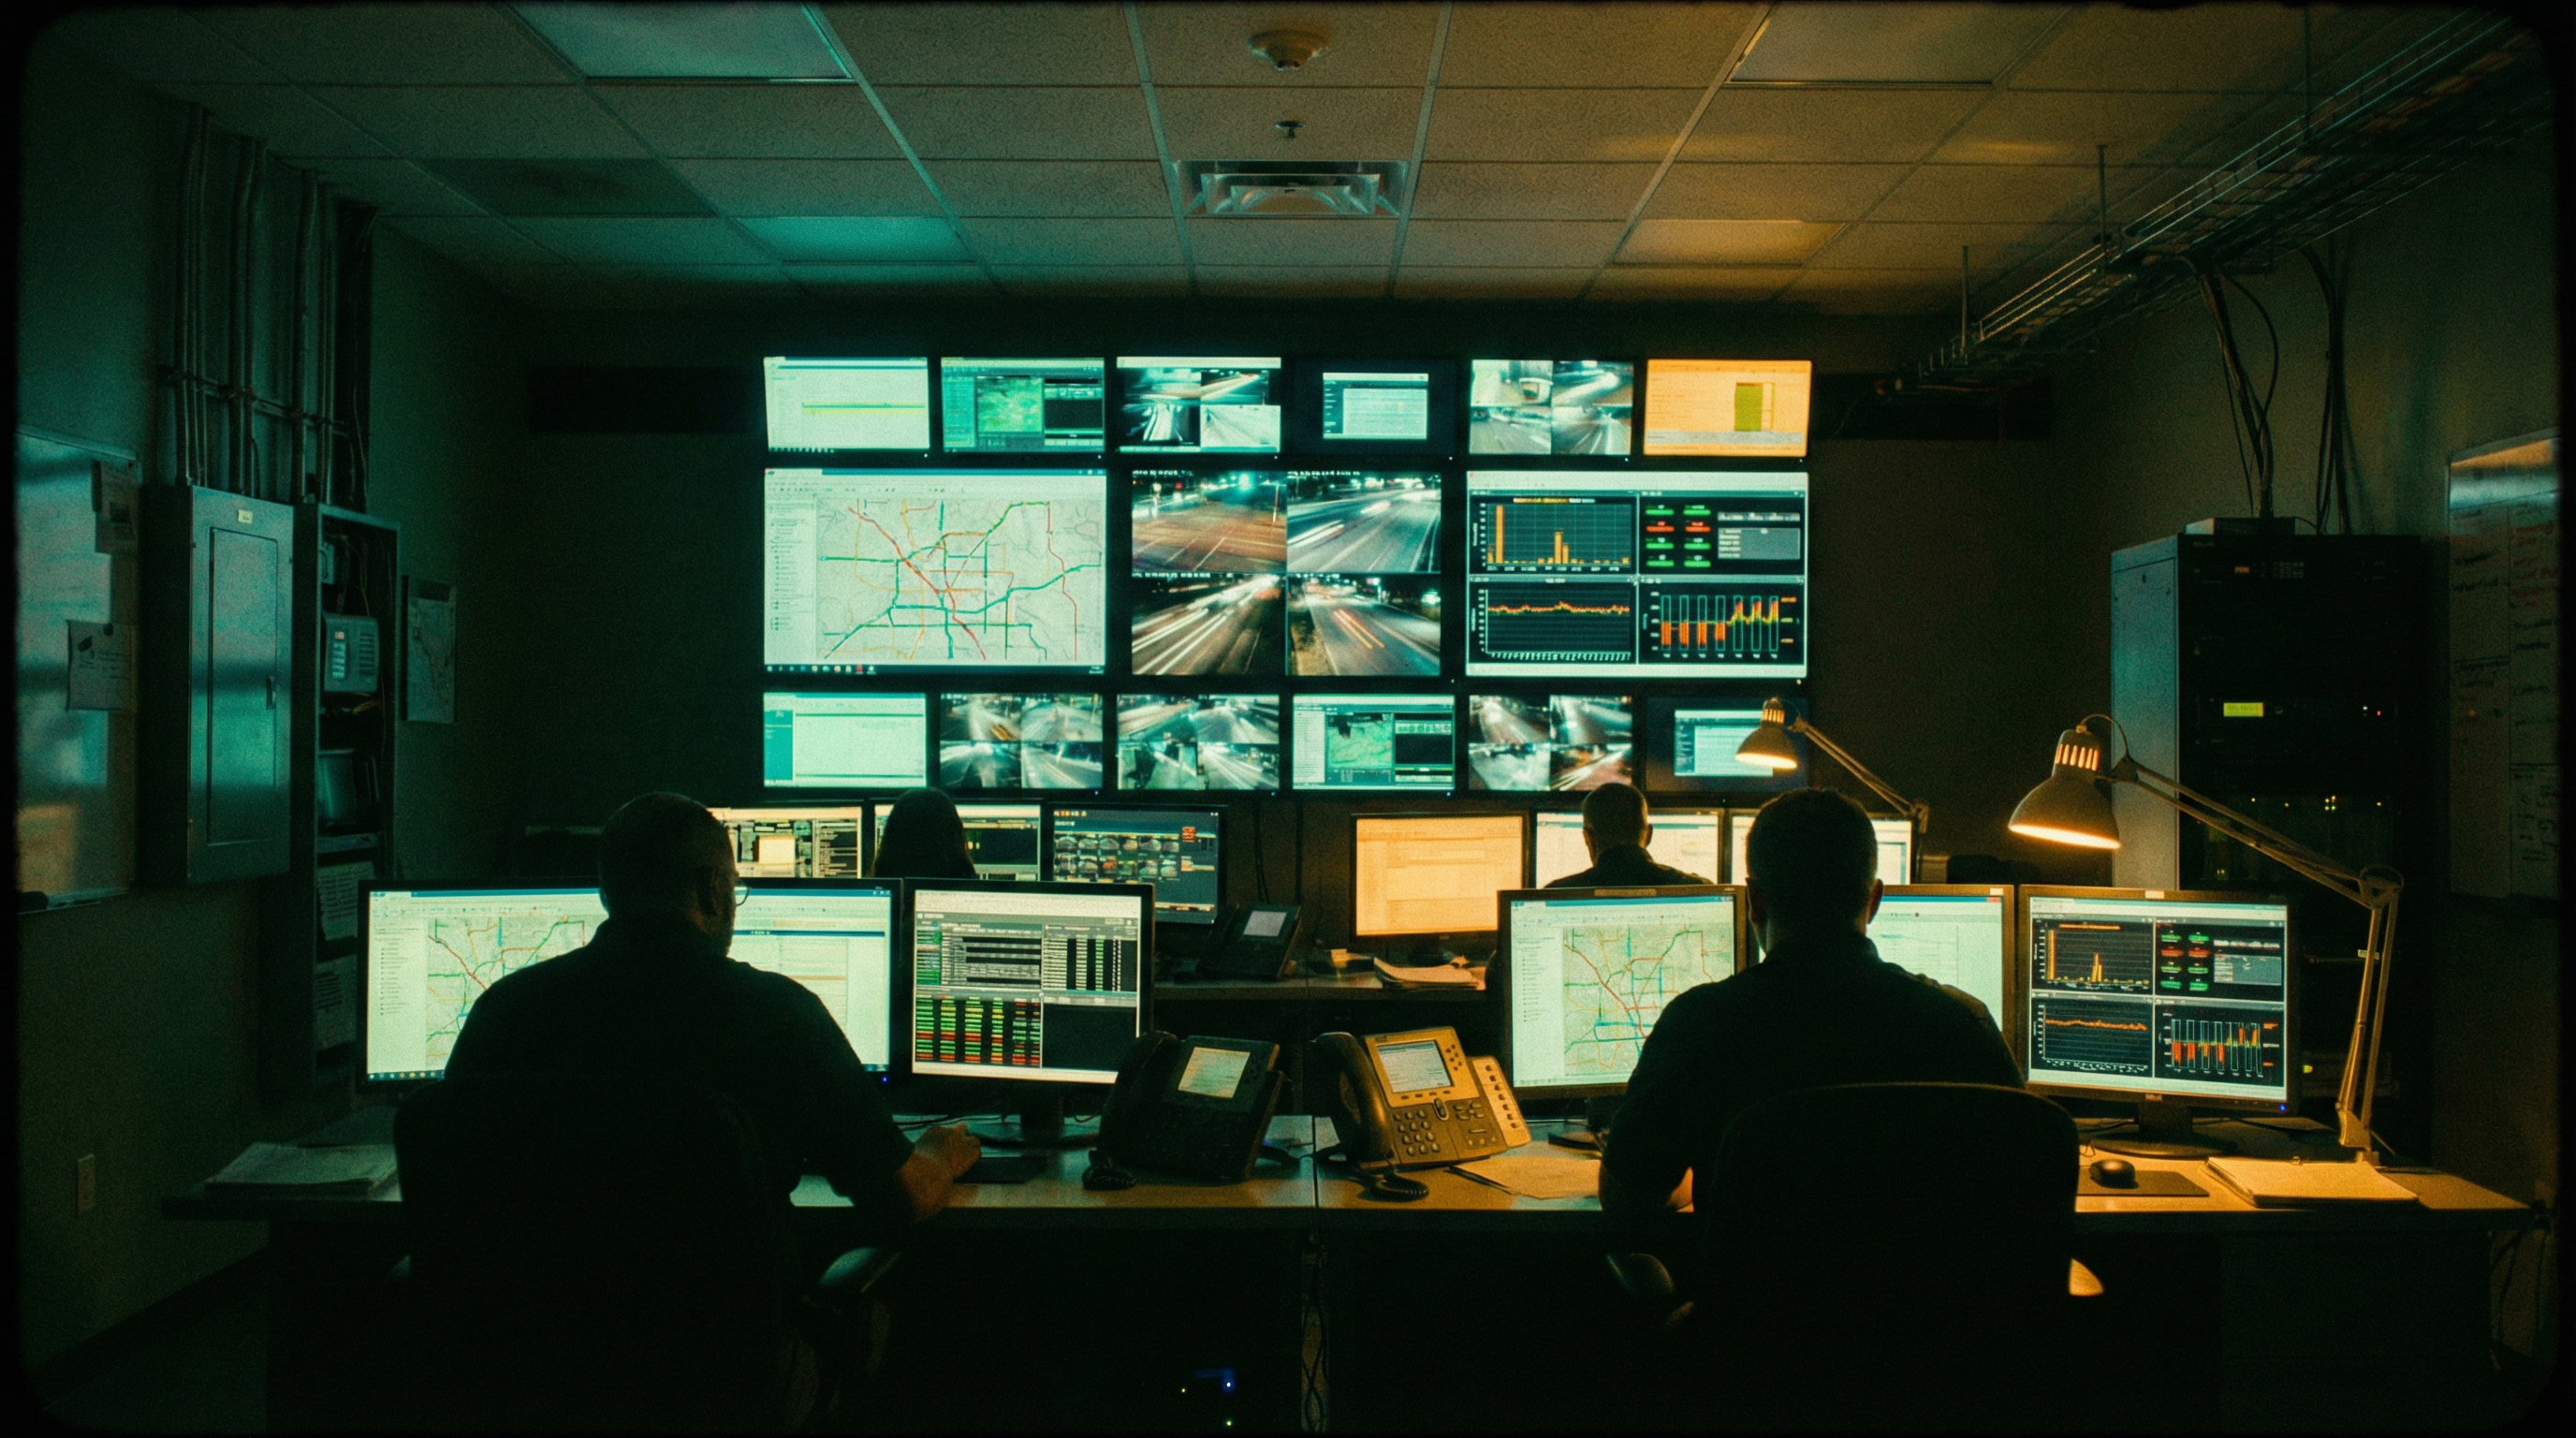
In practice, the gap is filled by people. Small teams (often three to five analysts) who spend their days switching between systems, manually cross-referencing records, and assembling intelligence products from fragments.
This manual correlation work is invisible in most operational assessments. It doesn’t appear as a line item. It doesn’t show up in technology audgets. But it consumes the majority of the analytical team’s working hours.
Consider the daily reality. A vessel appears on the AIS feed in a restricted zone. The analyst needs to determine whether this vessel is authorized, whether it has a history of violations, whether it matches any dark vessel alerts, and whether the zone it’s operating in has any active research or tourism activities that might be affected.
Each of those questions requires a different system. Each system requires its own authentication, its own query syntax, its own interface conventions. The analyst isn’t doing intelligence work. They’re doing data plumbing, manually joining tables that should have been joined by software.
The operational cost is measured in three currencies. First, time: what takes software milliseconds takes an analyst minutes or hours. Second, coverage: a team of three cannot manually correlate every vessel, every day. They check what they can and hope nothing critical falls through. Third, continuity: when the team goes home at night, the monitoring stops. The ocean doesn’t.
Protected areas that operate twenty-four-hour surveillance mandates with eight-hour analytical teams are running on hope during the gap hours. The data streams continue flowing. Nobody is watching them correlate.
The Terrestrial Blind Spot
Maritime surveillance, for all its fragmentation, at least has tools. Vessel tracking systems exist. Dark vessel detection programs are funded. The maritime domain has been the focus of international conservation technology investment for two decades.
Terrestrial monitoring in protected areas tells a different story. In many of the world’s most important conservation zones, land-based threat detection relies entirely on foot patrols. Rangers walk routes based on experience and intuition. They find what they find. They miss what they miss.
The gap is not that terrestrial threats are harder to detect. Satellite imagery at thirty-centimeter resolution can identify new construction, land clearing, trail formation, invasive species encroachment, and vehicle presence in restricted areas. The imagery exists. The processing capability exists. AI change detection can flag anomalies between successive satellite passes with high accuracy.
The gap is that this capability remains disconnected from field operations. Satellite imagery is processed in one system. Change detection results are delivered in another format. Patrol planning happens in a third system, or, more commonly, on paper. The ranger who walks the trail in the morning has no pre-briefing intelligence from the satellite that passed overhead last night.
When terrestrial change detection and patrol operations share a common operational model, the dynamic shifts fundamentally. Rangers don’t patrol blind. They patrol with a briefing map that tells them exactly where to look and what changed since their last visit. The satellite becomes the night shift. The ranger becomes the response team. Each multiplies the other.
The Overnight Problem
Conservation threats don’t observe office hours. Illegal fishing peaks at night when patrol vessels are docked. Unauthorized land access happens on weekends when ranger stations are minimally staffed. Poaching follows the pattern of least resistance, and least resistance correlates directly with least surveillance.
The structural answer to the overnight problem is not more people. It’s autonomous correlation. When the AIS feed shows a vessel entering a restricted zone at 2:00 AM, and the dark vessel detection system flagged an RF emission in the same area at 1:45 AM, and the satellite pass from six hours ago showed a small boat staged at a nearby beach, that correlation should happen automatically, generate an alert, and produce an evidence package before anyone wakes up.
The morning briefing should begin with overnight intelligence, not overnight data. The difference is the correlation layer: the capacity to reason across sources, apply operational rules, and surface the events that matter, without requiring a human to be awake, logged in, and manually querying four systems.
This is what an operational intelligence model provides for conservation. Not a new sensor. Not a replacement for any existing system. A governed layer that connects what already exists, correlates it continuously, and delivers intelligence at the speed the mission requires.
What Changes When the Systems Share a Common Model
The transformation is not dramatic in any single dimension. It’s cumulative. Each connection between previously isolated systems produces a small operational gain. The aggregate effect changes what’s possible.
Vessel registration data joined with real-time position tracking produces continuous compliance monitoring, not spot checks. Satellite change detection joined with patrol planning produces intelligence-led field operations, not random walks. Dark vessel alerts joined with permit records and vessel history produces contextualized threat assessment, not isolated alarms.
The three-person team that spent its days on data plumbing now spends its days on analysis. The coverage that was limited to what humans could manually check now extends to every vessel, every satellite pass, every sensor reading, continuously. The overnight gap that existed between the evening shift and the morning briefing is filled by software that doesn’t sleep.
None of this requires replacing the systems that conservation agencies already operate. It requires connecting them. The AIS feed continues to flow. The vessel registration database continues to run. The satellite imagery continues to arrive. What changes is that they finally share a common operational model, a governed data layer where every source becomes a queryable, correlatable, auditable intelligence product.
The conservation mission has never lacked dedication or courage. What it has lacked is the intelligence infrastructure to make limited resources operate at the scale of the threats they face. The sensors are already deployed. The data is already flowing. The missing layer is the one that makes them work together.
The Funding Implication
International conservation funding increasingly requires evidence of impact. Donors want to see detection rates, response times, and measurable outcomes, not just patrol hours logged and fuel consumed.
An operational intelligence model produces those metrics as a byproduct of normal operations. Every correlation becomes a data point. Every automated alert becomes a measurable detection. Every evidence package becomes auditable proof that the system is working.
Protected area agencies that can demonstrate quantified operational results (compliance rates, detection-to-response times, coverage percentages, threat trend analysis) position themselves fundamentally differently in funding conversations. They’re not asking for money to try something. They’re showing evidence of what works and requesting resources to scale it.
The shift from monitoring to intelligence isn’t just an operational upgrade. It’s a funding strategy. When the data proves the model works, the investment case writes itself.