What 'Operational Visibility' Actually Means When You Run 30 Systems
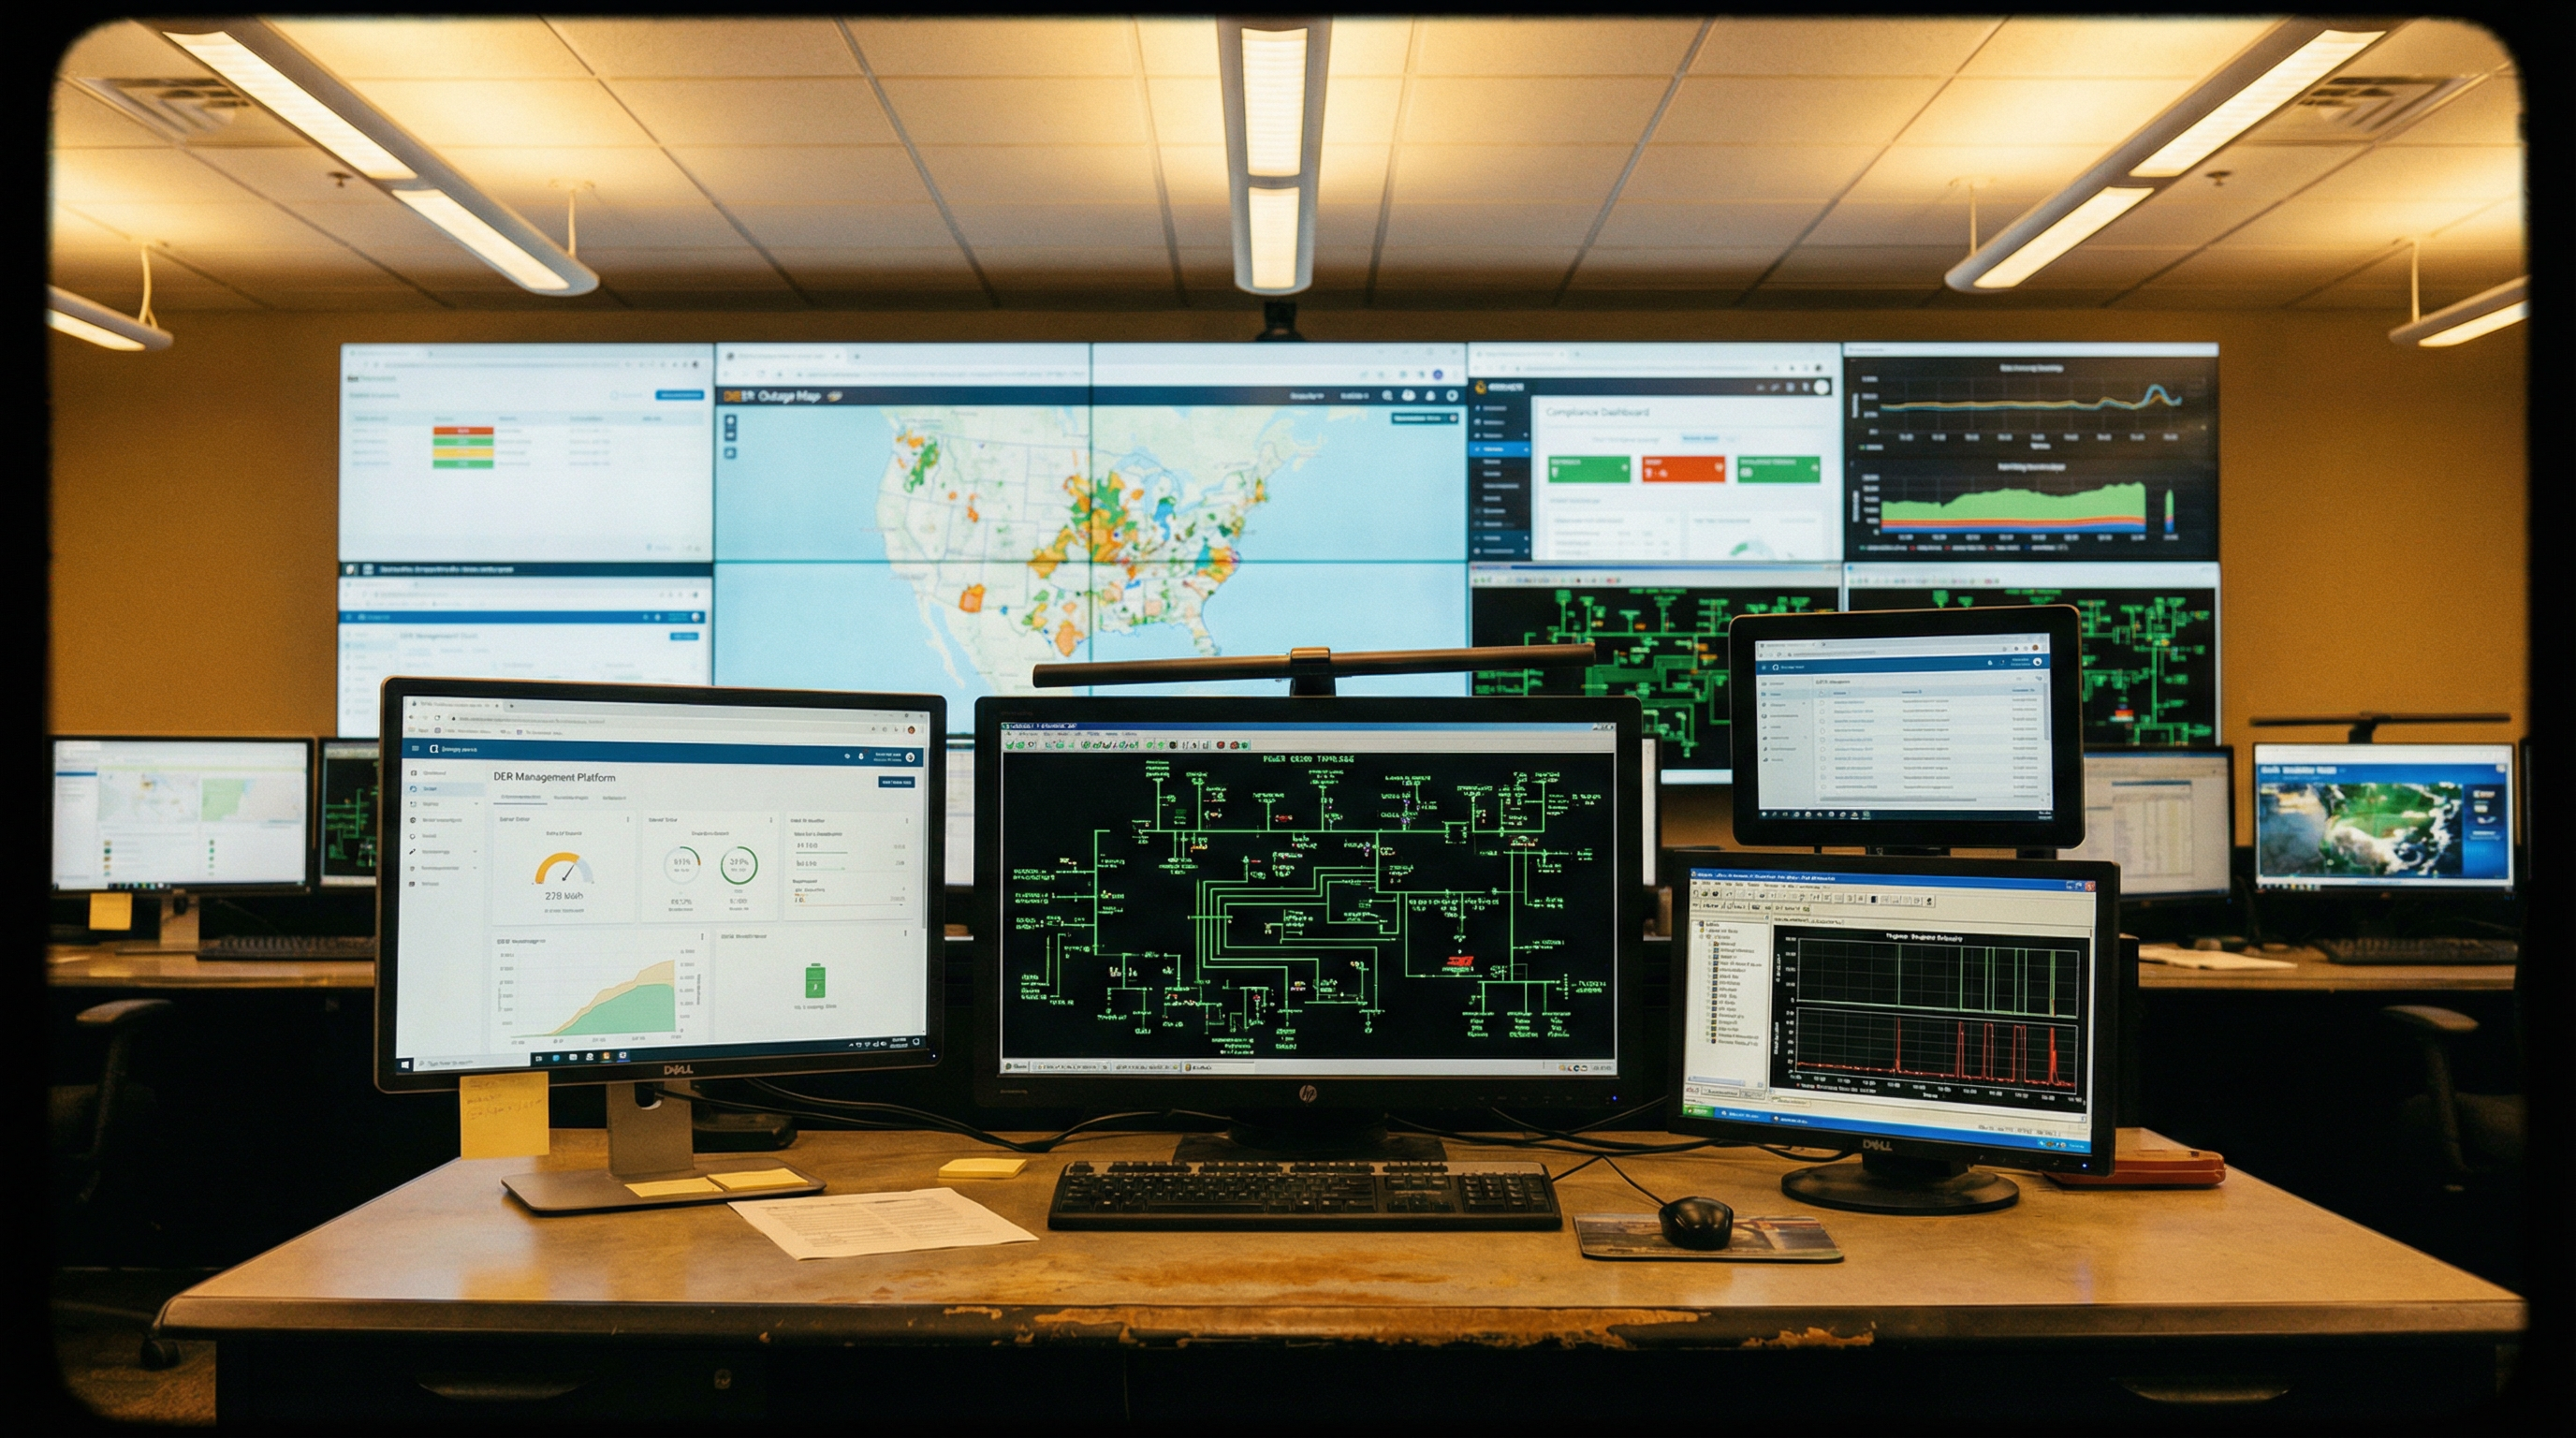
Every vendor promises visibility. But when your operation runs 15-30 disconnected systems, visibility isn't a dashboard, it's a structural engineering problem.
The Dashboard Illusion
Every software vendor in your inbox right now is selling you visibility. They’ll show you a dashboard. It will be clean. It will be responsive. It will consolidate some data.
Then you’ll deploy it.
And the energy operator will still toggle between SCADA for grid state, a DER aggregation platform for distributed resources, a historian for time-series trends, and an asset management system for maintenance windows. That’s four sources of truth before the Operations Center Automation system comes online. Before the DERMS. Before the grid modernization consultant’s proprietary analysis tool.
The defense commander will keep cycling through five separate security consoles because each one shows something the others don’t.
The NOC manager will have Nokia for one part of the network, Ericsson for another, Cisco for the backhaul, and their own performance tooling. Adding a new dashboard doesn’t consolidate these views, it creates a sixth screen to switch to when something breaks.
The city will maintain visibility tools across water, traffic, safety, and facilities because each department built their own. The mayor’s office wants one view. The departments need their own. The integration layer that connects them doesn’t exist, so neither does the visibility.
This is the visibility paradox: adding more screens doesn’t create visibility. It creates switching costs.
Visibility as a Structural Problem
Real operational visibility isn’t about dashboards. It’s about whether the systems that run your operation speak the same language about what’s happening.
Imagine a pressure reading from a pipeline. In the SCADA historian, it’s a time-series point with a tag name. In a pressure-monitoring IoT device, it’s a sensor output with different units. In the ERP system where maintenance technicians log compressor health, it’s a narrative note about what they observed. In the geospatial system, it’s located at coordinates in a region under specific wind and weather conditions.
None of these systems know they’re talking about the same physical reality. So when the pressure drops and correlates with a vibration spike at the compressor station, and that correlates with a maintenance report from three days ago about bearing noise, you find out about all three things, but your systems don’t.
Visibility means they do.
A structural operational model means a pressure reading from a pipeline means the same thing whether it comes from SCADA, IoT, an edge device, or a technician’s field report. When that pressure drops, the model automatically traces the correlation to the compressor bearing wear recorded in the ERP, the weather patterns that accelerated the degradation, and the spare parts inventory that needs to move before Wednesday.
That’s not a dashboard problem. That’s an integration architecture problem. And until the architecture solves it, no amount of visualization fixes the visibility gap.
What Changes When Systems See Each Other
The shift from fragmented systems to a unified operational model is practical. Not aspirational.
A grid operator who saw DER instability in an aggregation platform yesterday has no way to know whether those inverters are failing or responding to a SCADA event on the main grid. Once the DER data and SCADA data share a common operational model, the operator sees both simultaneously. Instability doesn’t become another silo. It becomes a resolved question.
A defense installation that monitors perimeter security through video and motion sensors has a problem: a technician walking along the fence at 2 AM could be maintenance or could be intrusion. The cyber team monitors network anomalies separately. Once perimeter events and cyber events share a structural model, a perimeter motion event that correlates with an unauthorized network access attempt during the same window becomes a signal, not noise. The security team doesn’t get another alert. They get connected intelligence.
A city that manages water, traffic, safety, and facilities separately receives calls about street flooding, traffic congestion, and unsafe conditions as disconnected incidents. Once the water-main-break event correlates structurally with traffic patterns and safety dispatch, the city doesn’t add another monitoring system. It pre-coordinates response. The traffic team reroutes. Safety arrives at the right location with the right equipment. Fleet dispatch anticipates resource demands. All from one structural model that connected systems that never knew they should talk to each other.
A network operator who monitored terrestrial and satellite networks on separate platforms had no way to see which backup circuits would fail together under specific failure modes. Once terrestrial and satellite faults share a common operational model, the operator sees the dependency. Redundancy becomes real instead of theoretical.
These aren’t visualization improvements. They’re structural shifts that change what’s operationally possible.
The 8,000-Integration Reality
This is where the work lives.
True operational visibility doesn’t mean you replace your systems. You can’t. You’re running SCADA systems that have been operating for fifteen years. You’re running defense networks architected to specific standards. You’re running city databases that predate modern integration patterns. You’re running networks built by three vendors across different decades.
Visibility means connecting to what’s already there. SCADA systems. Historians. DER platforms. IoT suites. ERP systems. GIS databases. Cyber tools. Facilities management systems. Vendor APIs. Legacy protocols. Field devices. Geospatial data. Weather feeds. Asset registries. Every integration point that already exists in your operation.
That’s not a dozen integrations. It’s hundreds. Across dozens of vendors. Across multiple protocols. Across systems that weren’t designed to share a model.
The integration layer that solves this isn’t about building connectors. It’s about building a structural capability that can normalize disparate data sources into a unified operational model, and keep that model current as your systems evolve. That’s the engineering problem.
The vendor who understands this doesn’t ask you to migrate away from your existing systems. They ask you to connect them structurally. The energy operator keeps SCADA. The defense team keeps their separate security consoles for domain-specific control. The NOC keeps their vendor-specific tools. The city keeps their departmental databases. But they all share a unified operational model that lets them see, correlate, and act on what’s actually happening across all of them.
That’s operational visibility. Not another screen. A structural shift in how your systems see each other.


